
Education
Head Start
Key Takeaways
The percentage of Fremont-area Head Start students making progress toward meeting widely held expectations increased from Fall to Spring. Additionally, 100 percent of Fremont-area Head Start students expected to enter kindergarten in the Fall are making progress toward meeting widely held expectations related to language, social emotional development, and cognitive development. More than three fourths are also making progress toward meeting widely held expectations related to physical development, literacy, and mathematics.

A Look Into Head Start
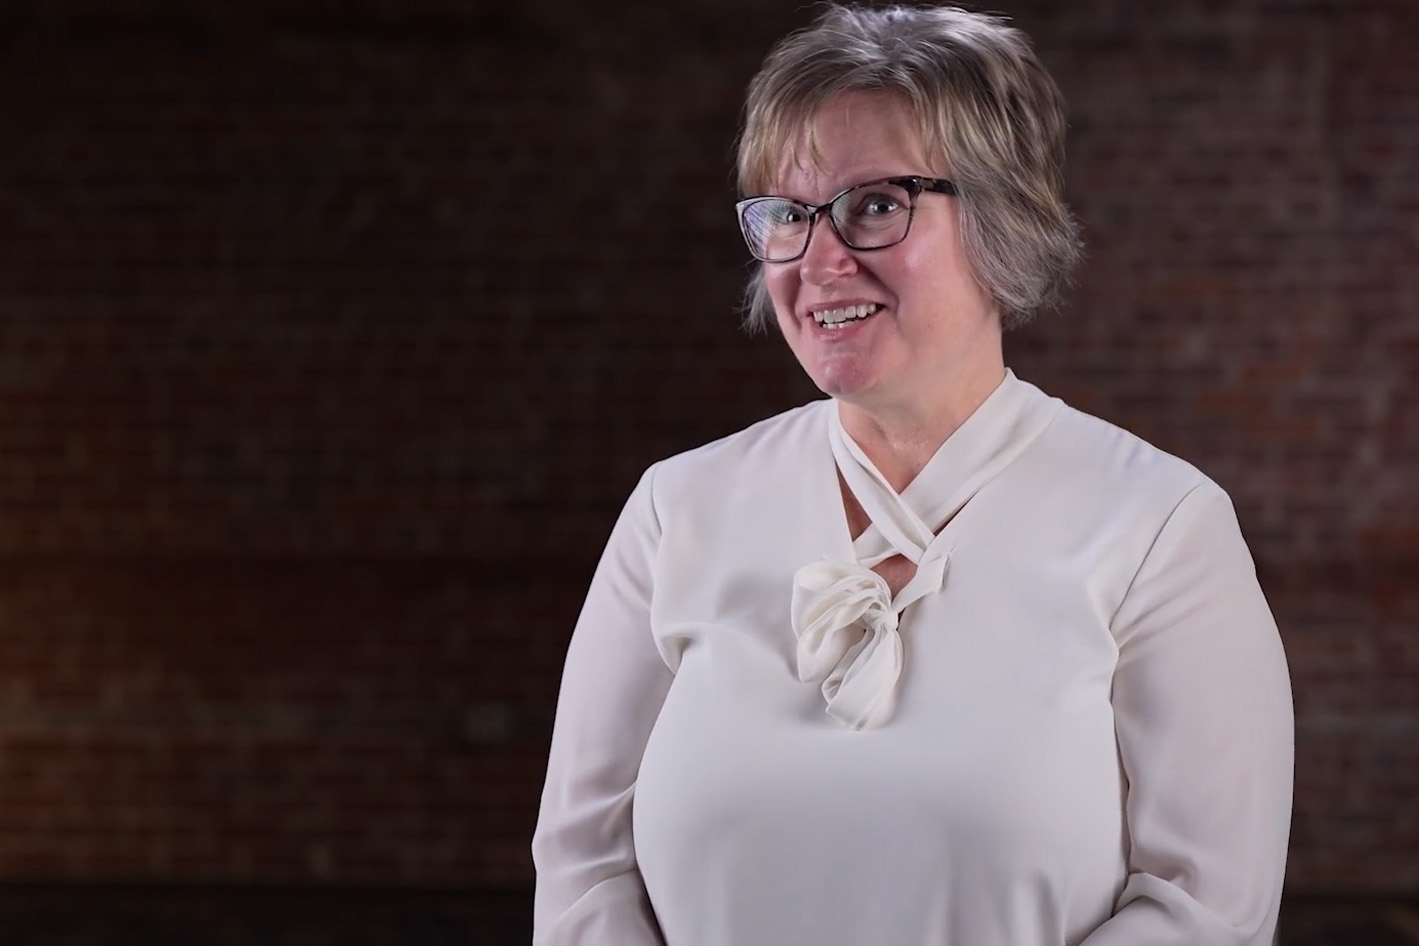
Meet Kristen Fagan
What's included in this data?
This figure provides information about the percentage of Head Start students in the Fremont area who are one year away from attending kindergarten who are making progress meeting widely held expectations. Head Start is a free, federally-funded program designed to promote school readiness for children between 3 and 5 years old from families that meet income eligibility requirements. Widely held expectations refer to the knowledge, skills, and abilities that children of a particular age or grade would typically demonstrate over a year of life or from the beginning to the end of a program year. These expectations fall into several categories, including social emotional expectations, physical expectations, language expectations, cognitive expectations, literacy expectations, and mathematics expectations. Student data related to these expectations is collected and measured for each student using Teaching Strategies GOLD, a standardized assessment tool. The figure specifically shows how the percentage of students making progress toward meeting these expectations changes between assessments conducted in the Fall, Winter, and Spring.